Creating an extended events session
Creating an Extended Events session is pretty straightforward with SQL Server 2012 as Microsoft has finally introduced a graphical user interface. (Extended Events itself arrived in SQL Server 2008, but until 2012 you had to write T-SQL to use it, and it is the modern replacement for the deprecated SQL Trace and Profiler.) During my time as a DBA, I often needed to create a quick trace to capture query activity for a particular table. So, let's run through how we might do this with Extended Events!
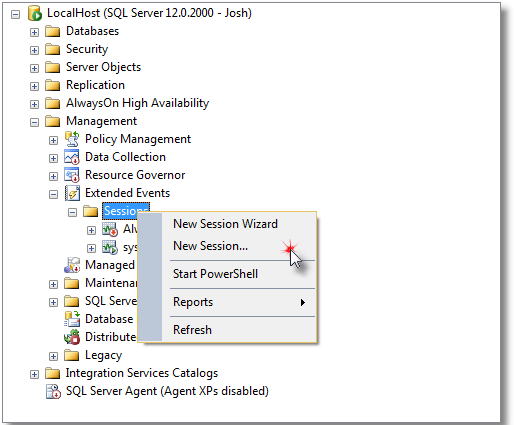
First things first, we need to open SQL Server Management Studio, connect to a SQL Server running SQL 2012 or above and then browse down to Server → Management → Extended Events → Sessions. Here you will want to right-click and then select "New Session". (You'll need the ALTER ANY EVENT SESSION permission, which members of the sysadmin role have.)
General
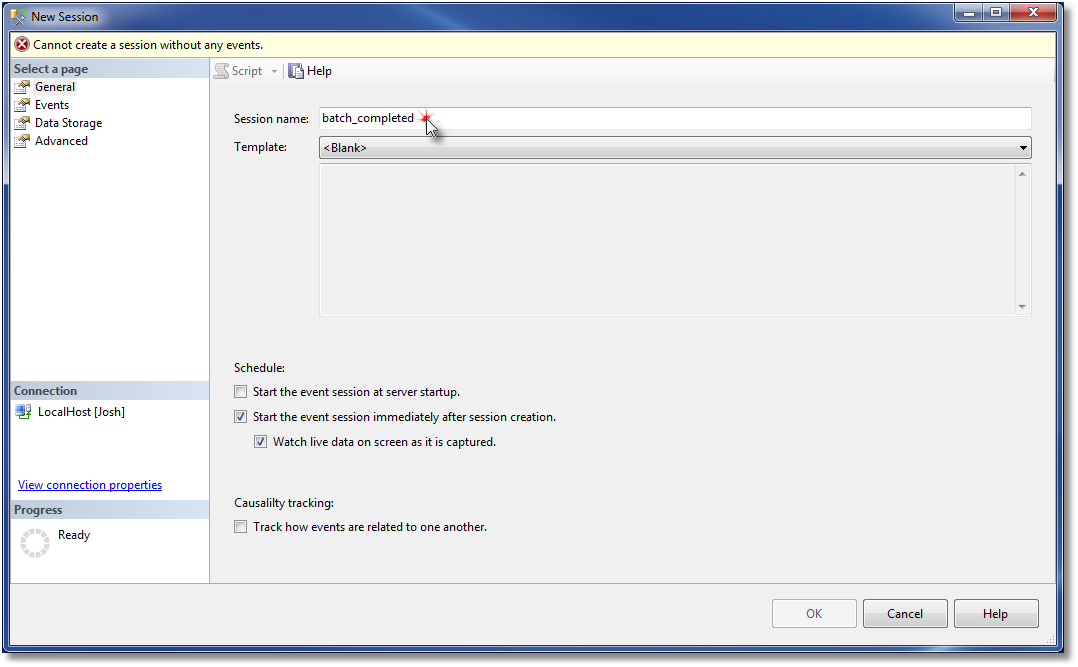
On this setup page, give the session a name and also select some of the general options. For this example, I am going to select "Start the event session immediately after session creation" because this will save me the time it takes to start it manually. I will also select "Watch live data on screen as it is captured". We can easily open the live view later, but this option will save you a step.
Click "Events" on the left to proceed.
Events
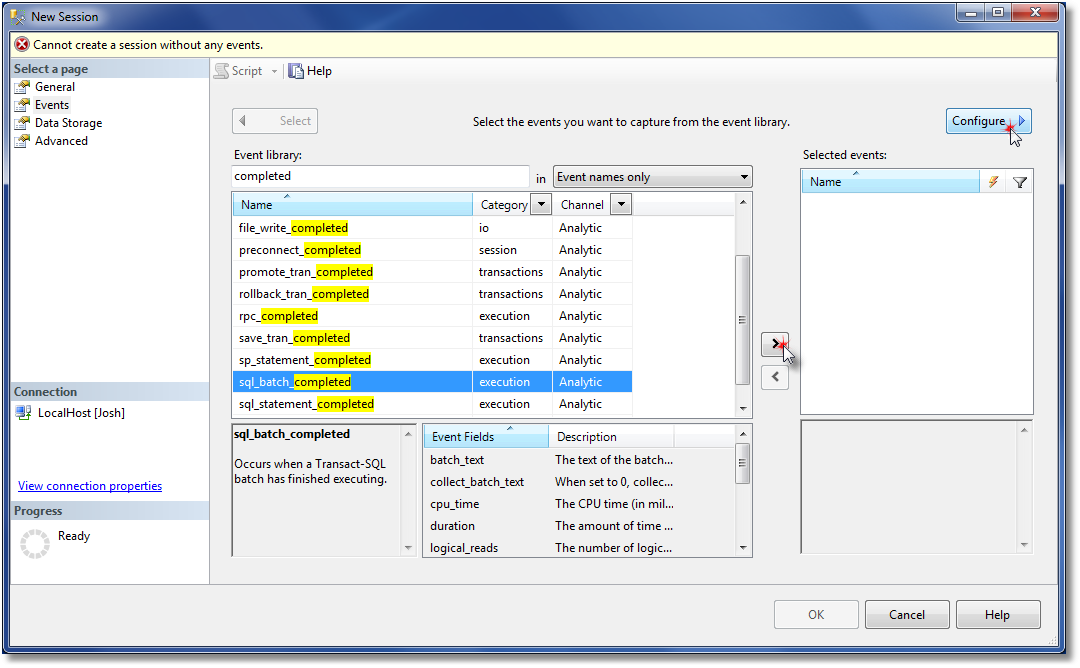
This is where we get into the meat of Extended Events. Here we will select the event(s) that we want to capture on the left and add them to our "Selected events" list on the right. For this example, I typed "completed" in the event library search box to quickly pare down to the event that I am interested in. Select sql_batch_completed and then add it to the list via the ">" button.
A quick note on choosing events: sql_batch_completed captures batches sent as ad hoc T-SQL text. Queries that applications send as RPC calls (stored procedure calls and parameterized queries, for example) are captured by rpc_completed instead, and statements running inside a stored procedure show up in sql_statement_completed. If you want to see all of the activity against a table, you will probably want more than one of these.
Click "Configure" at the top right to proceed.
Events: Configure
If you want, you can skip this step entirely in order to capture all of the selected event data with no filtering.
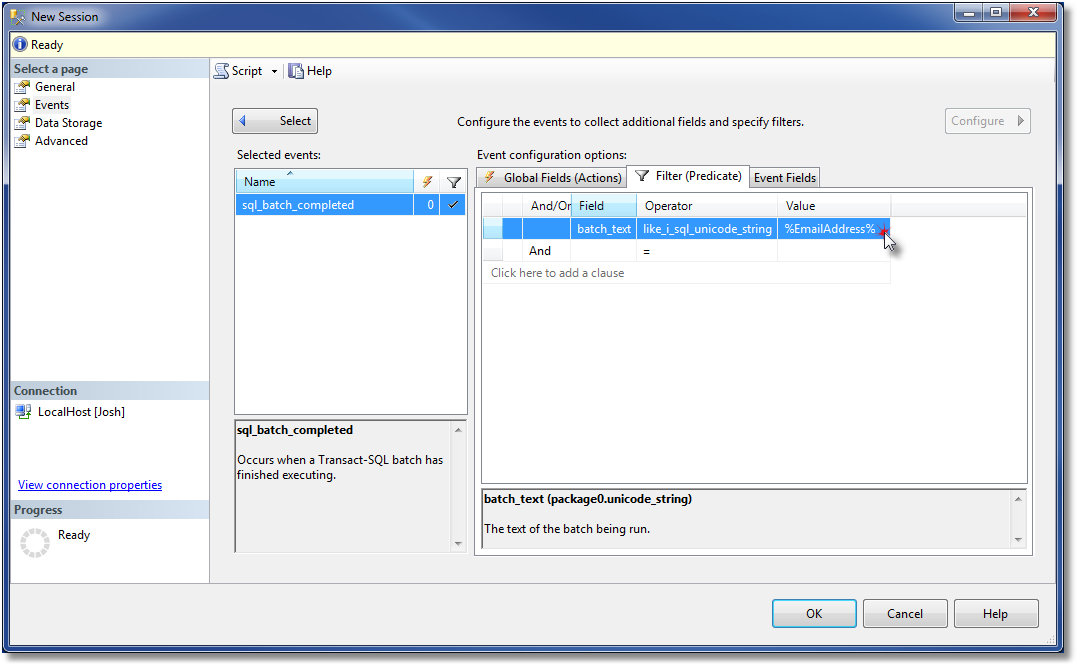
I have a local copy of the AdventureWorks database, so I'm going to add a filter on %EmailAddress%.
On the left, select the event that you want to configure and then click on the "Filter (Predicate)" tab on the right. To add a filter predicate, click the drop-down menu in the "Field" column of the grid and select batch_text. Now, select the like_i_sql_unicode_string operator. While the name is a bit long, this is simply a case-insensitive LIKE clause on a Unicode string. Type in a value (remember to include the % wildcards, as in %EmailAddress%, or it will only match the exact text) and we are done on this page.
Click "Data Storage" on the left to proceed.
Data Storage
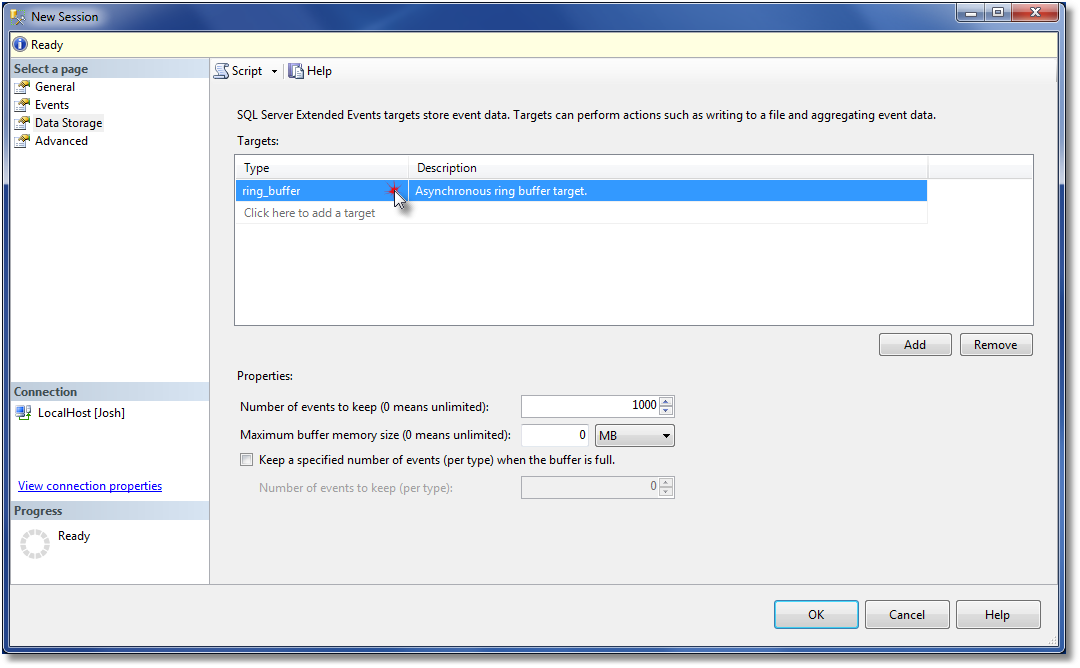
On this page, we want to specify how the collected data is stored. There are many options available, but the details of each are out of the scope of this example.
I'm going to go with ring_buffer for this example because it's very straightforward and allows me to easily specify a maximum number of events without worrying about filling up my database or disk drive. Keep in mind that the ring buffer lives in memory, so the oldest events are discarded as it fills and everything in it is lost when the session is stopped or the instance restarts. If you need to keep the data, use the event_file target instead.
Advanced
The Advanced page is once again out of scope. In an effort to be concise, we didn't touch on many of the configurable options in any of these steps.
Click "OK" at the bottom right to proceed.
Live Data
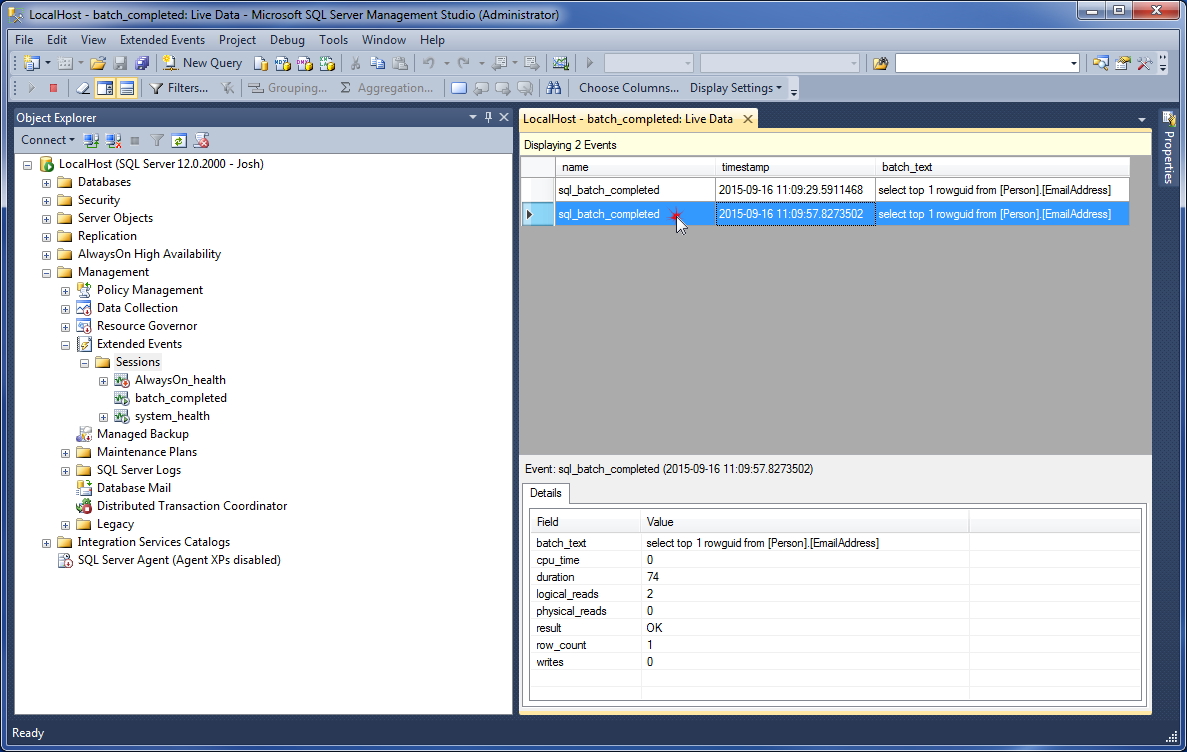
At this point, you should have the XE live data viewer open. If not, then right-click the new session that we created in the Object Explorer tree and click "Watch Live Data".
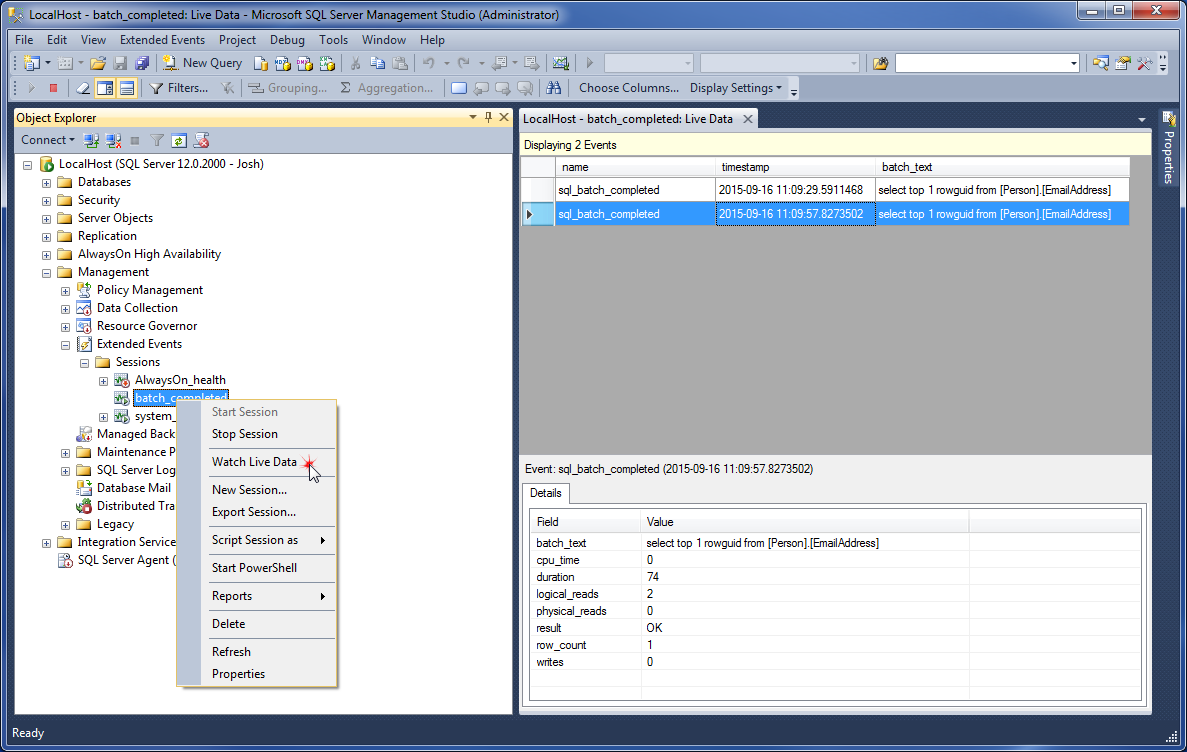
From this window you can view the occurrences of the events which you selected. The top grid portion shows the events themselves while the bottom grid shows details about the currently highlighted event.
Personally, I think the most important thing you should know here is that you can add columns from the bottom grid onto the top grid by right-clicking on the top grid column headers and selecting "Choose Columns" (or by right-clicking a field in the details grid and choosing "Show Column in Table").
Also note that when you are in the Live Data view, you now have a new toolbar in SSMS. Be sure to play around with "Filters" at the very least!